
Table of Contents
First, credit where it’s due. Anthropic publishing this is rare and useful. Most companies sit on their abuse data. They plotted a year of it on MITRE ATT&CK and made it public. What follows is me building on their work, and I’d genuinely like it pressure-tested.
Let’s start with what the data actually shows.
Anthropic caught and banned 832 accounts on its own Claude platform. It measures what those actors asked an AI to help with, not success metrics. It says nothing about the broader frontier AI landscape, and nothing about what bad actors do with open or jailbroken models that have no guardrails. Read it with that frame, or it’s easy to draw the wrong conclusion.
I don’t think anyone should read too much into the size of any single box.
Take phishing. AI-assisted phishing requests dropped 8.6% from the first half of the study to the second. That’s a small change in what got requested and caught on one guardrailed platform. It says little about whether phishing got less effective in the real world, which I doubt it did. These are also per-technique counts, and real operations chain many techniques together. No single percentage tells you how much an attack leans on personal data.
That last point is what I want to test out loud.
ATT&CK is a chain, not a leaderboard
MITRE ATT&CK was built as a sequence. Reconnaissance, resource development, initial access, all the way to impact. A technique mostly means something in the context of the step before it and the step after it.
So sorting by “most used” mostly surfaces the steps that are unavoidable. Of course, malware development is near the top. Everyone has to build something and run something. Ranking those is a bit like learning that most car trips involve a steering wheel.
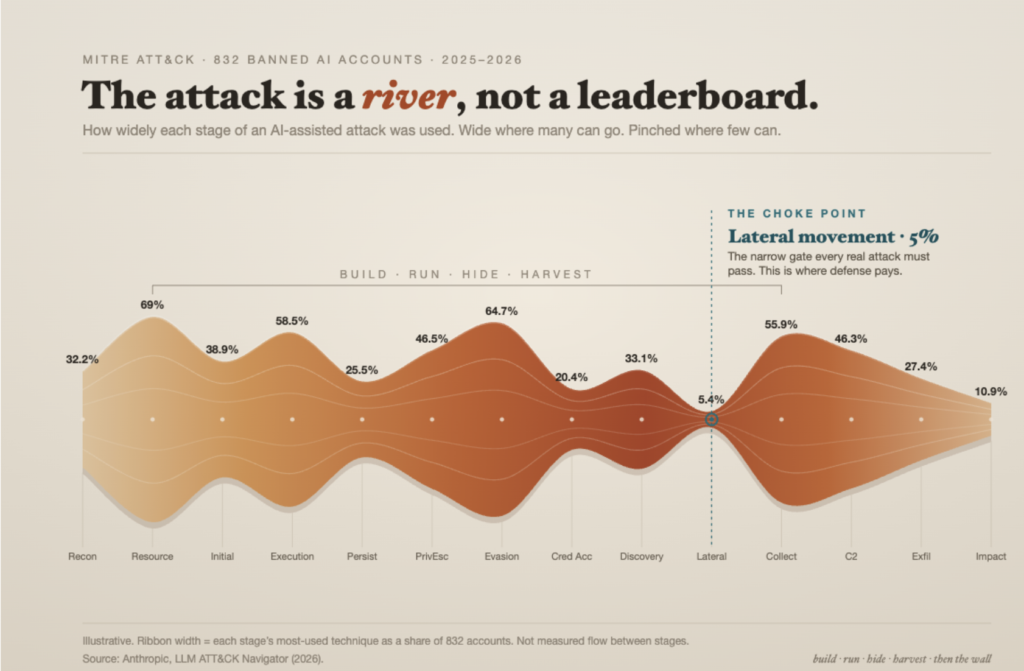
Read it as a chain, and the picture reorders itself: build, run, hide, harvest. Develop capability (69%). Execute it (58%). Obfuscate and disable defenses (65% and 55%). Collect local data (56%). Those numbers cluster because they overlap heavily, and the math forces it. At least a quarter of all accounts were developed and executed.
Then you hit a cliff. Lateral movement, the moment an attacker moves sideways inside a live network, tops out around 5%. The line is fat through collection and pinches almost shut the second the work becomes hands on keyboard inside someone’s environment. If that holds up, the rare and valuable part of an attack is getting in and moving, and that’s the narrow gate every completed operation has to pass.
My working hypothesis, and where I want it challenged
There’s one technique that walks around that gate: valid accounts. Log in as a real user and you skip the loud fight across the network. That’s why valid accounts recurred across four stages of the attack at 18.4%. It’s a skeleton key.
Now look at the front of the chain, the opening moves that decide whether an attacker gets going at all. They appear to run on exposed personal data. Phishing is the number one initial-access technique at 38.9%, and its quality depends on what’s known about the target. Gathering a target’s identity information sits at 14.7%. Valid accounts, meaning leaked or phished credentials reused to log in, recur at 18.4%. Even password spraying needs valid usernames and email formats to start.
So here’s the hypothesis I’d put up for debate: if you reduce the personal information exposed about your people, you raise the cost of the cheapest opening moves and push attackers toward the loud in-network grind where defense actually works. That’s the exposure my own work targets, so treat me as biased and check it.
The front of the chain has no lock
Notice what “where defense actually works” really means. Controls exist there. Every technique in MITRE ATT&CK ships with a Mitigations section, the official playbook for stopping it. For the in-network steps, those are real. Patch the software. Segment the network. Run endpoint detection. Pull up identity gathering at the front of the chain and MITRE basically throws up its hands. The technique “cannot be easily mitigated with preventive controls since it is based on behaviors performed outside of the scope of enterprise defenses and controls. Efforts should focus on minimizing the amount and sensitivity of data available to external parties.” That’s the framework admitting the busiest front door, phishing at 38.9%, is the one with no lock.
Someone will name MFA, phishing training, and email filtering. Good controls. But they all sit at the moment of attack, and they all fail. Stacking more of the same doesn’t help because every layer is downstream and fed by the same exposed data. The move is cutting the fuel. Less exposed identity data means worse targeting, fewer credentials to try, weaker lures, and the controls you already have get tested less. That’s the missing layer.
Where I’d push back on myself
The real shift Anthropic flags is the one that should worry us, and I agree with it. AI is starting to stitch the whole chain together with less and less human input. Cutting exposure doesn’t slow that trend.
It’s also lane-specific. There are two front doors here. Phishing at 38.9% cares deeply about what’s known about your people. Exploiting a public-facing application at 34% doesn’t care at all. Reducing exposure does a lot to one door and almost nothing to the other.
And the frame from the top still applies. One platform, requests rather than outcomes, guardrailed models only. The mechanism feels sound to me. This particular table can’t size the prize, in either direction, and I’d rather say that plainly than oversell it.
What would actually settle this
The answer is that this table can’t, because marginal percentages aren’t pathways. What would settle it is data this chart doesn’t contain: per-account sequences. Which techniques actually co-occur, and in what order? That’s the difference between “these are popular” and “this is the common road in.”
So this is an open question, not a conclusion. If you work in threat intelligence, defense, or data science, I’d love to know where this reading breaks. Has anyone modeled real attacker pathways as transitions rather than counts? Does the lateral-movement cliff survive once you account for attacks that were stopped early? Is the opening-moves-run-on-PII pattern real, or an artifact of one platform’s data?
I rebuilt the full Navigator dataset to work through this and I’m happy to share it with anyone who wants to argue with the numbers directly. I’d rather be corrected than confident.